
h-index Calculator: Calculate and Understand Your Impact
💡 How To Use This Well
- Take your citation counts from one database and say which one. Scopus, Web of Science and Google Scholar index different journals, so they return different numbers for the same person.
- Quote the m-quotient alongside the h-index when you are early in your career. A raw h-index compares you unfavourably with people who have simply been publishing longer.
- Keep your first-author and corresponding-author counts to hand. Fellowship forms ask for them, often at short notice.
- Where a funder specifies a database or a metric definition, use theirs rather than these.
⚠️ What These Numbers Cannot Tell You
- Citation metrics vary enormously between fields. A strong h-index in mathematics would be modest in cell biology, so comparisons only mean something within a discipline.
- The h-index cannot fall and cannot exceed your publication count, which makes it insensitive both to a single landmark paper and to a run of weak ones.
- Review articles and methods papers attract citations far beyond their originality, and a handful can lift an h-index substantially.
- The San Francisco Declaration on Research Assessment asks institutions not to use journal-level metrics as a proxy for the quality of individual work. Treat any single number as one input among many.
- Career breaks, part-time work and field-switching all depress these figures without saying anything about the research.
📋 Disclaimer
This calculator is provided for personal reference and planning only. It computes standard metrics from the numbers you enter and cannot verify them. It is not a research assessment, carries no evaluative weight, and should not be used to rank or compare individuals. Funders, institutions and appointment panels apply their own definitions, databases and field norms, and those always take precedence over anything shown here.
📐 How Each Metric Is Calculated
1. The h-index
2. The i10-index
3. The g-index
4. The m-quotient
5. Authorship shares
6. Where the numbers come from
On the responsible use of metrics, see the San Francisco Declaration on Research Assessment.
Your h-index is one number standing in for a whole research career, which is exactly why it is both useful and easy to misread. This guide explains what the h-index measures and what it deliberately ignores, how to calculate it alongside the i10-index, g-index and m-quotient, why three databases will give you three different answers, and how to judge whether a figure is good without relying on invented benchmarks. It is written for PhD students, postdocs and early-career researchers — factual information only.
What the h-index measures, and what it deliberately ignores
The h-index was proposed by the physicist Jorge Hirsch as a single number to describe the output of a researcher. His definition is precise: a scientist has index h if h of their papers have at least h citations each, and the remaining papers have h or fewer citations each.
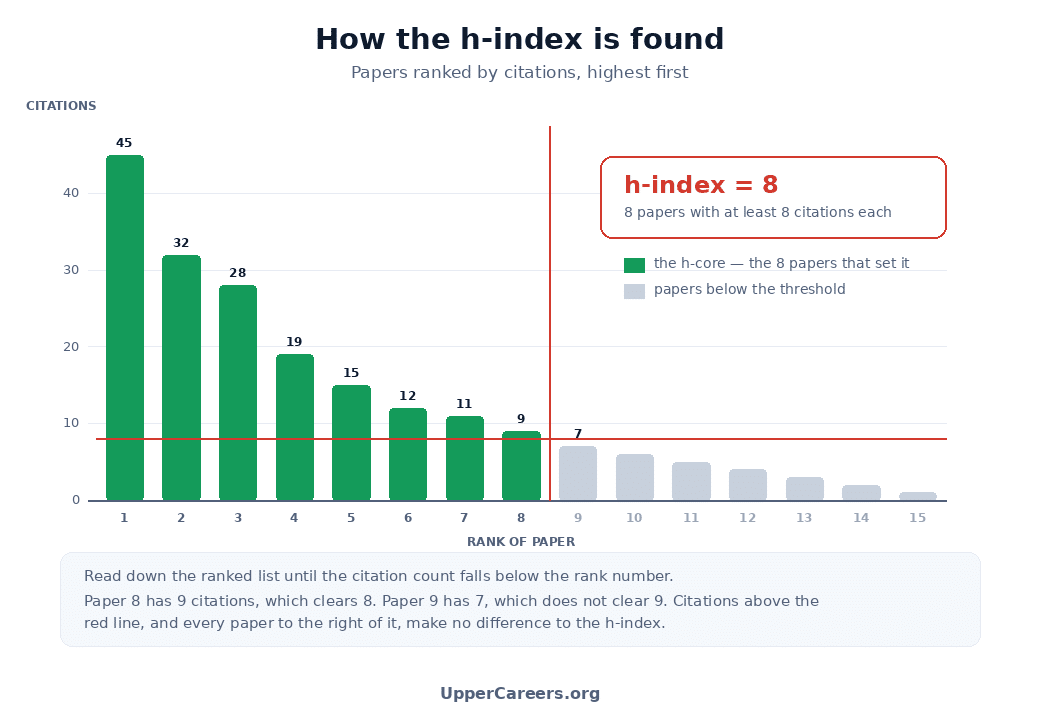
In plain terms: sort your papers by citations, highest first, then walk down the list until the citation count drops below the position number. The last position that still holds is your h-index.
A worked example
Take a researcher with fifteen papers, cited 45, 32, 28, 19, 15, 12, 11, 9, 7, 6, 5, 4, 3, 2 and 1 times.
| Rank | Citations | Does it clear the rank? | Verdict |
|---|---|---|---|
| 6 | 12 | 12 is more than 6 | Yes |
| 7 | 11 | 11 is more than 7 | Yes |
| 8 | 9 | 9 is more than 8 | Yes — this sets the h-index |
| 9 | 7 | 7 is less than 9 | No — the walk stops here |
The h-index is 8. Those eight papers are known as the h-core, and they are the only ones the metric looks at.
What it throws away
This is where most misreadings begin. The h-index ignores a great deal by design:
- Citations above the threshold. The top paper in the example has 45 citations, but only 8 of them do any work. The other 37 are invisible to the metric.
- Every paper below the threshold. Seven papers in the example contribute nothing at all.
- Your position in the author list. A paper where you did the work counts exactly the same as one where you contributed a reagent.
- How many co-authors there were. A single-author paper and a paper with two hundred authors are treated identically.
Two researchers, one number
Consider two people who both have an h-index of 8.
The first has eight papers, every one cited between 8 and 12 times, all as first author, all in her own subfield. The second has ninety papers, of which one is a landmark review cited 400 times, eight more scrape past the threshold, and the remaining eighty-one are middle-author contributions to large consortium papers.
The metric cannot tell them apart. Nothing in the number distinguishes a focused independent record from a broad collaborative one. That is not a flaw in how you are using it; it is what the h-index is.
Understanding this is what stops the h-index being misleading. It is a useful summary of sustained, cited output. It is not a measure of quality, originality, contribution, or worth — and it was never designed to be.
How to calculate the h-index, i10-index, g-index and m-quotient
All four metrics come from the same input: a list of citation counts, one per publication. They differ only in what they do with it.
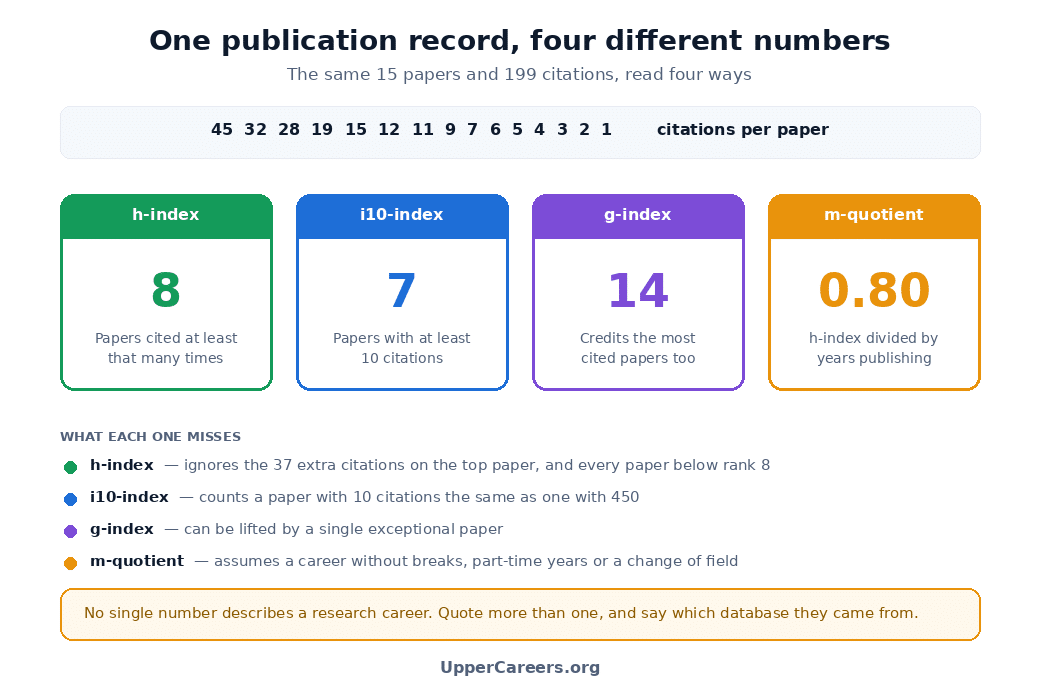
The four metrics side by side
| Metric | How it is found | What it rewards | When to quote it |
|---|---|---|---|
| h-index | h papers with at least h citations each | A sustained body of cited work | Almost always; it is the figure people expect |
| i10-index | Count of papers with at least 10 citations | Breadth of moderately cited output | Early in a career, when it moves before the h-index does |
| g-index | Top g papers holding at least g² citations between them | Highly cited papers, which the h-index caps | When one or two papers carry unusual weight |
| m-quotient | h-index divided by years since your first publication | Rate of progress rather than total | Whenever you are being compared with someone more senior |
The m-quotient, and why early-career researchers should use it
The h-index rises with time almost automatically, because citations accumulate and the metric can never fall. Comparing a third-year PhD student with a professor of thirty years using raw h-index tells you mostly how long each has been publishing.
The m-quotient divides that out. An h-index of 8 after ten years gives m = 8 ÷ 10 = 0.80. The same h-index of 8 after four years gives m = 2.00, a very different picture of the same number.
If you are early in your career and a form asks only for an h-index, add the m-quotient and the number of years alongside it. It costs one line and it changes how the figure reads.
Why three databases give you three different answers
Your h-index is not a property of you. It is a property of a database. Scopus, Web of Science and Google Scholar index different sets of journals, conference proceedings and repositories, so each counts a different pool of citations.
The pattern is consistent: Google Scholar returns the highest figure of the three, because it indexes the widest range of material, including theses and repository copies. Web of Science typically returns the lowest, because its selection is the most restrictive. Scopus usually falls between them.
- Quote one database and name it. “h-index 12 (Scopus)” is honest and checkable. An unlabelled number invites the reader to assume you picked the flattering one.
- Use the one your reader uses. If a funder specifies a source, use theirs, whatever it does to the number.
- Never mix sources. Taking citation counts for some papers from one database and some from another produces a figure that describes nothing.
Is my h-index good? Interpreting the number honestly
This is the question everyone asks, and it deserves a straight answer: there is no universal benchmark, and any page that publishes one is guessing. A table claiming that a good h-index for a biologist is one number and for a mathematician another cannot be sourced, because the underlying citation cultures differ so much that a single figure would be meaningless.
That is not a dodge. It is the reason the question is hard, and there is a practical way around it.
What moves an h-index without saying anything about the research
| Factor | Effect on the number | Effect on the research |
|---|---|---|
| Field | Large; citation rates differ by an order of magnitude between disciplines | None |
| Subfield size | Large; a small specialism has fewer people available to cite you | None |
| Years publishing | Large; the h-index can only rise over time | None |
| Career breaks and part-time work | Depresses it | None |
| Changing field | Depresses it; a new area starts the accumulation again | None |
| Writing review articles | Raises it, often sharply | Different in kind, not better |
| Team and consortium size | Raises it where large author lists are the norm | None |
| Database chosen | Moves it by several points either way | None |
Every row in that table changes the number without changing the work. That is why cross-field comparison is not a slightly rough guide — it is simply invalid.
The method that actually works: build your own comparator set
If no published benchmark can help, the alternative is to build one for yourself. It takes a few minutes and gives you something a generic table never could: real figures for real people in your specific subfield at your specific career stage.
- Decide who you are comparing yourself with. Not “chemists” — something like “electrochemists who finished a PhD five to eight years ago and now hold their first independent position.”
- Find fifteen or twenty of them. Recent first authors in the journals you publish in, speakers at your field’s main conference, or a search of an indexed researcher database.
- Record their h-index from a single database. The same one for everyone, or the comparison collapses.
- Look at the spread, not the average. You are trying to see whether you sit inside the normal range for that group, not to find a target to hit.
The UpperCareers Supervisor Finder makes step two considerably faster. It indexes hundreds of thousands of active researchers and lets you filter by discipline, country and minimum h-index, so you can pull together a set of comparable people in your own field rather than guessing at a national or global figure.
Use the spread as context, not as a target. An h-index is a lagging indicator of work you did years ago. Setting out to raise it directly is how researchers end up chasing citable topics instead of interesting ones.
What the research-assessment community says
There is a well-developed body of opinion on this, and it is worth knowing before you put a number on a CV. The San Francisco Declaration on Research Assessment asks institutions and funders not to use journal-based metrics as a substitute for judging the quality of individual research, and to assess work on its own merits. The Leiden Manifesto sets out principles for using quantitative indicators responsibly, including that metrics should support expert judgement rather than replace it.
The practical reading for an applicant: quote your metrics accurately, quote more than one, and never let them stand in place of an account of what your research actually did.
How to use the calculator and present your metrics
The UpperCareers h-index calculator works from a list of citation counts. Everything is entered by hand, nothing is stored, and it computes all four metrics at once along with your authorship shares.
1 · Get your citation counts
Open your profile in one database and copy the citation count for each publication.
- Google Scholar — your profile page lists every paper with its citation count, sorted by citations already.
- Scopus — your author profile shows the document list with citation counts, exportable to a spreadsheet.
- Web of Science — the citation report for your author record gives the same, usually the most conservative of the three.
2 · Paste them in
Commas, spaces or line breaks all work, and the order does not matter because the calculator sorts them. Text mixed in with the numbers is ignored, so you can paste a rough copy without cleaning it up first.
3 · Set the years and authorship counts
Enter the number of years since your first publication for the m-quotient, then the number of papers where you are first author and where you are corresponding author. These last two are asked for on fellowship forms far more often than people expect.
4 · Read the breakdown
The publication table highlights your h-core, so you can see exactly which papers set your h-index and how close the next one is to joining them.
What to quote in which document
| Document | Usually worth including | Why |
|---|---|---|
| PhD application | Publications and citations, if any | An h-index at this stage carries almost no information |
| Postdoc application | h-index, m-quotient, first-author count | The m-quotient offsets a short career; first authorship shows independence |
| Fellowship application | All four metrics, database named, authorship shares | Panels frequently ask for authorship position explicitly |
| Academic CV | h-index and total citations, database named | The convention most readers expect |
| Promotion case | h-index, corresponding-author count, trajectory | Corresponding authorship signals research leadership |
Using the h-index when choosing a supervisor
Applicants often use an h-index to pick a PhD or postdoc supervisor, and it is a reasonable screening input as long as you know what it does and does not tell you.
A high h-index tells you a researcher’s work is cited and that they have been active for a while. It tells you nothing about whether they are taking students, whether they supervise closely or hands-off, whether their group is functional, or whether their current direction matches your interests. Some of the best supervisors have modest numbers because they work in small subfields; some with very high numbers run groups so large that a new student may rarely see them.
If you want to filter by h-index as a starting point, the Supervisor Finder lets you set a minimum alongside discipline, country and whether the researcher is accepting students — then read the actual work before you write to anyone.
Preparing an application at the same time? The GPA Converter and the ECTS Calculator handle the other two numbers most international applications ask for.
Mistakes that produce a misleading figure
- Mixing databases. Citation counts from different sources cannot be combined into one h-index.
- Quoting an unlabelled number. Always name the database and the date you took it.
- Comparing across fields. Meaningless, as the previous tab explains.
- Leading with the h-index early on. With a handful of papers it is close to uninformative; total citations and first-author count say more.
- Treating it as a target. It is a lagging summary of past work, not something to optimise.
Where the metrics and the data come from
The definitions below come from the original literature, and the citation counts from the three main indexing databases. Where a funder or institution specifies a source, theirs takes precedence over all of these.
The original definition
- Hirsch, “An index to quantify an individual’s scientific research output”
The paper in the Proceedings of the National Academy of Sciences that introduced the h-index, including the definition quoted in this guide and the author’s own discussion of what the measure can and cannot support.
pnas.org
Citation databases
- Google Scholar
The broadest coverage of the three, indexing repositories and theses as well as journals. Free to use, and it computes the h-index and i10-index on your profile automatically. Expect the highest figure here.
scholar.google.com - Scopus
A curated, subscription database covering peer-reviewed literature across disciplines. Widely used by universities for reporting, and often the source funders name.
scopus.com - Web of Science
The most selective of the three in what it indexes, which usually makes it the most conservative source for an h-index. Also subscription-based, so access depends on your institution.
clarivate.com
On using metrics responsibly
- San Francisco Declaration on Research Assessment
A widely signed statement asking institutions, funders and publishers not to use journal-level metrics as a proxy for the quality of individual research contributions. Worth reading before you rely on any single figure.
sfdora.org - The Leiden Manifesto for research metrics
Ten principles for the responsible use of quantitative indicators in research assessment, including that metrics should support rather than replace expert judgement.
leidenmanifesto.org
Finding comparable researchers
- UpperCareers Supervisor Finder
A free search across hundreds of thousands of active researchers, filterable by discipline, country, minimum h-index and whether the researcher is accepting students. Useful for building a comparator set in your own subfield, and for finding supervisors whose work genuinely matches yours.
uppercareers.org/supervisors
Citation counts change continuously and databases revise their coverage. Take your figures fresh when you need them rather than reusing a number from an old application, and record which database and which date they came from.
Frequently asked questions
How do I calculate my h-index?
List every publication with its citation count, sort them from most cited to least, then read down the list until the citation count falls below the position number. The last position that still holds is your h-index. If your eighth-ranked paper has nine citations and your ninth has seven, your h-index is eight, because eight papers have at least eight citations each.
What is a good h-index?
There is no universal answer, and any table claiming otherwise is guessing. Citation rates differ enormously between fields, between subfields, and by how long someone has been publishing, so a figure that is strong in mathematics would be modest in cell biology. The only meaningful comparison is against researchers in your own subfield at a similar career stage. Build that comparator set yourself rather than trusting a published benchmark.
Why is my h-index different on Google Scholar and Scopus?
Because an h-index describes a database, not a person. Each source indexes a different set of journals, conference papers and repositories, so each counts a different pool of citations. Google Scholar covers the most material and returns the highest figure; Web of Science is the most selective and usually returns the lowest; Scopus generally sits between them. Quote one source, name it, and never combine counts from different databases.
What is the difference between the h-index and the i10-index?
The i10-index is simply the number of your publications with at least ten citations, with no weighting or threshold logic. The h-index requires h papers to have h citations each, so it rises more slowly and is harder to shift. The i10-index moves earlier in a career, which makes it useful for early-stage researchers, but it treats a paper with ten citations exactly the same as one with four hundred.
Can my h-index go down?
Within a single database it effectively cannot, because citations accumulate and papers do not lose them. It can appear to fall if you switch databases, if a database revises its coverage or merges duplicate author records, or if publications are retracted or reassigned. This one-way behaviour is part of why the m-quotient exists: it divides the h-index by years published, so it can fall when output slows.
What is a good h-index for a PhD student?
Most PhD students finish with an h-index between zero and about three, and many excellent students finish with zero because their work has not had time to be cited. At this stage the number carries almost no information. Selection panels look at what you published, where, your author position, and what the work actually contributed. If you are asked for metrics, give total citations and your first-author count rather than leading with an h-index.
Does the h-index account for co-authors?
No. A single-author paper and a paper with two hundred co-authors count identically, and your position in the author list makes no difference. This is one of the metric’s most criticised features, particularly in fields where large consortium papers are normal. Variants that divide credit among authors exist, but none is widely adopted, which is why funders increasingly ask for first-author and corresponding-author counts separately.
Should I put my h-index on my CV?
In most disciplines yes, provided you name the database and keep it current. The convention is a short line such as “h-index 12, 640 citations (Scopus)”. Add the m-quotient if you are early in your career, since it puts the figure in the context of how long you have been publishing. What matters more is that the metrics sit alongside an account of what your research did, rather than standing in place of one.
Educational and informational content only. UpperCareers does not assess research, does not rank researchers, and is not affiliated with any database or organisation named here. Citation counts change continuously, indexing coverage differs between databases and is revised over time, and this page may contain errors; take your figures fresh from a named database when you need them, and follow the definitions and sources specified by the funder or institution you are applying to.